In this article, we continue our impairments data series with an analysis of Q4 2020 impairments on the Clearwater system, and present the trends seen across 2020.
2019 Vs. 2020 Volumes
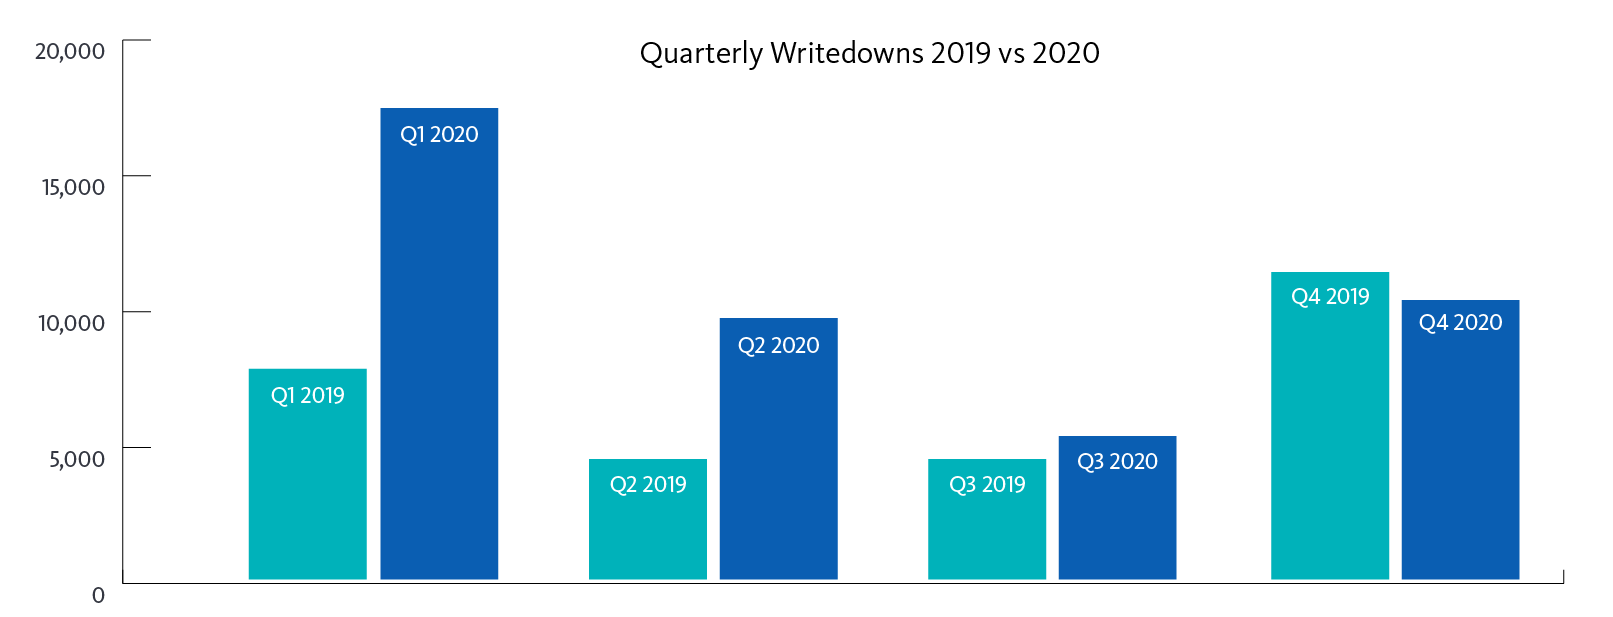
Volumes in H2 2020 were similar to H2 2019. This return to normal volumes, after unusually high volumes related to the beginning of the pandemic, may bode well for investors moving forward.

Trend Analysis by Asset Class & Market Sector
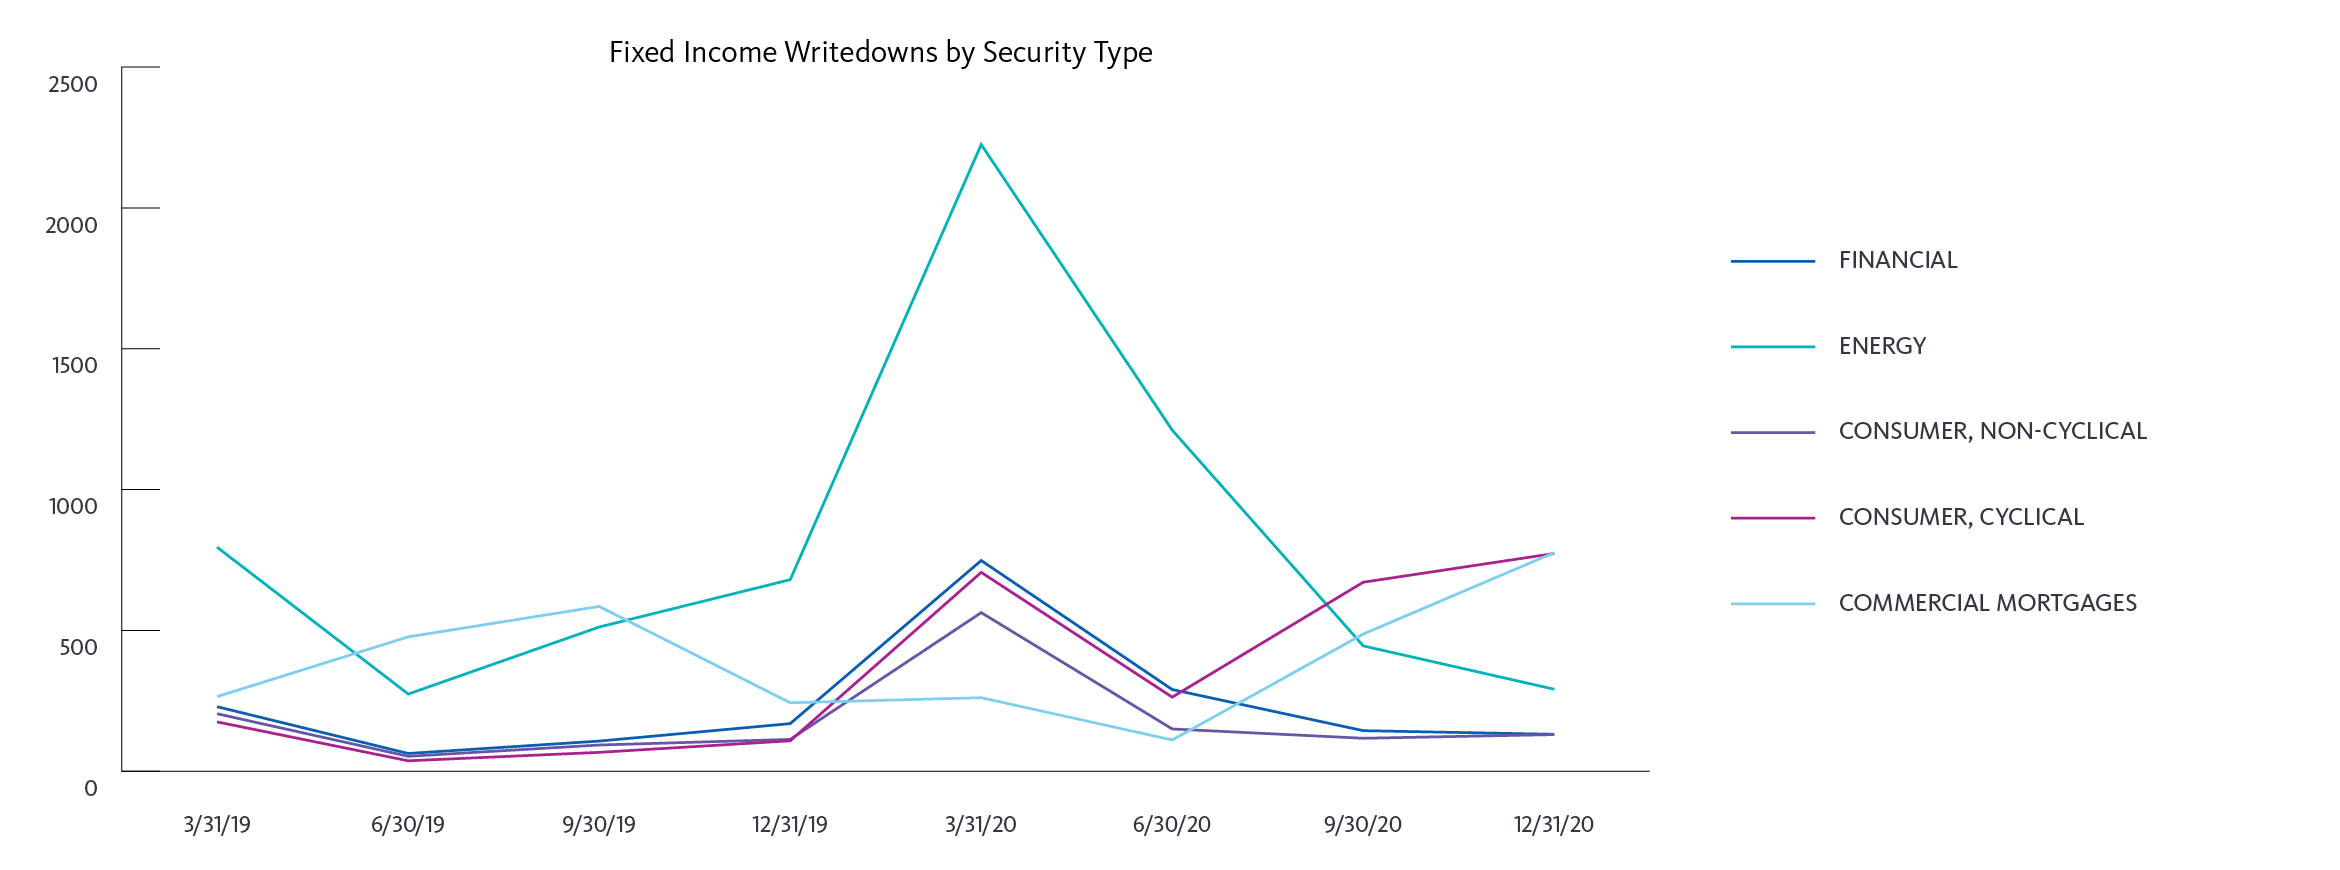
Fixed income write-down volumes stayed consistent in Q4 from the previous quarter, with energy finding a new two-year low. However, there was an observable uptick in the number of write-downs for the commercial mortgage and financial sectors. This was consistent with the data from Q3, confirming our assumption that commercial mortgage write-downs would lag other sectors, which saw high volumes of write-downs in H1 2020.
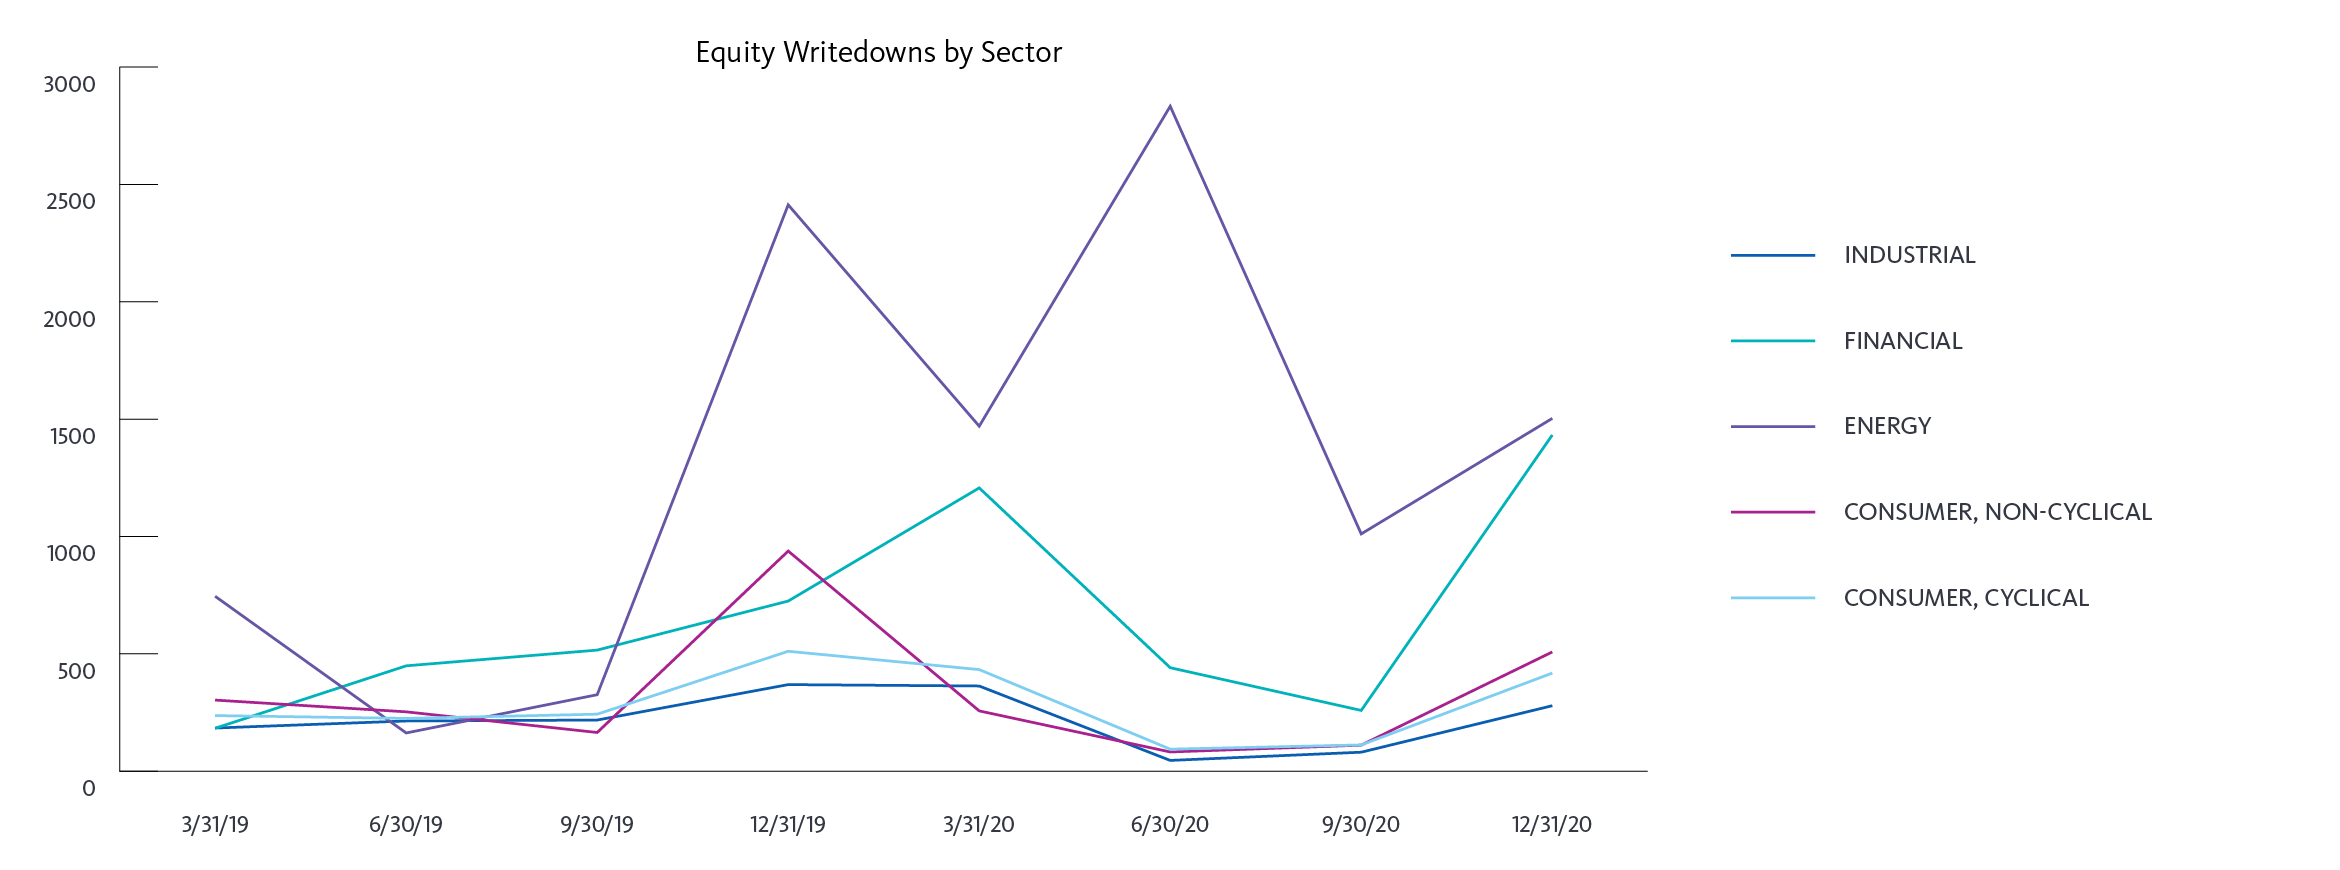
Equity securities saw a significant increase in overall volumes in Q4, as compared to Q3 2020; however, based on the trends from Q4 2019, this was not surprising. Energy continues to be the sector with the most absolute number of write-downs. Interestingly, financials rose in Q4 for equities, similar to what we observed in fixed income.


Diving Deeper: Top Issuers Analysis
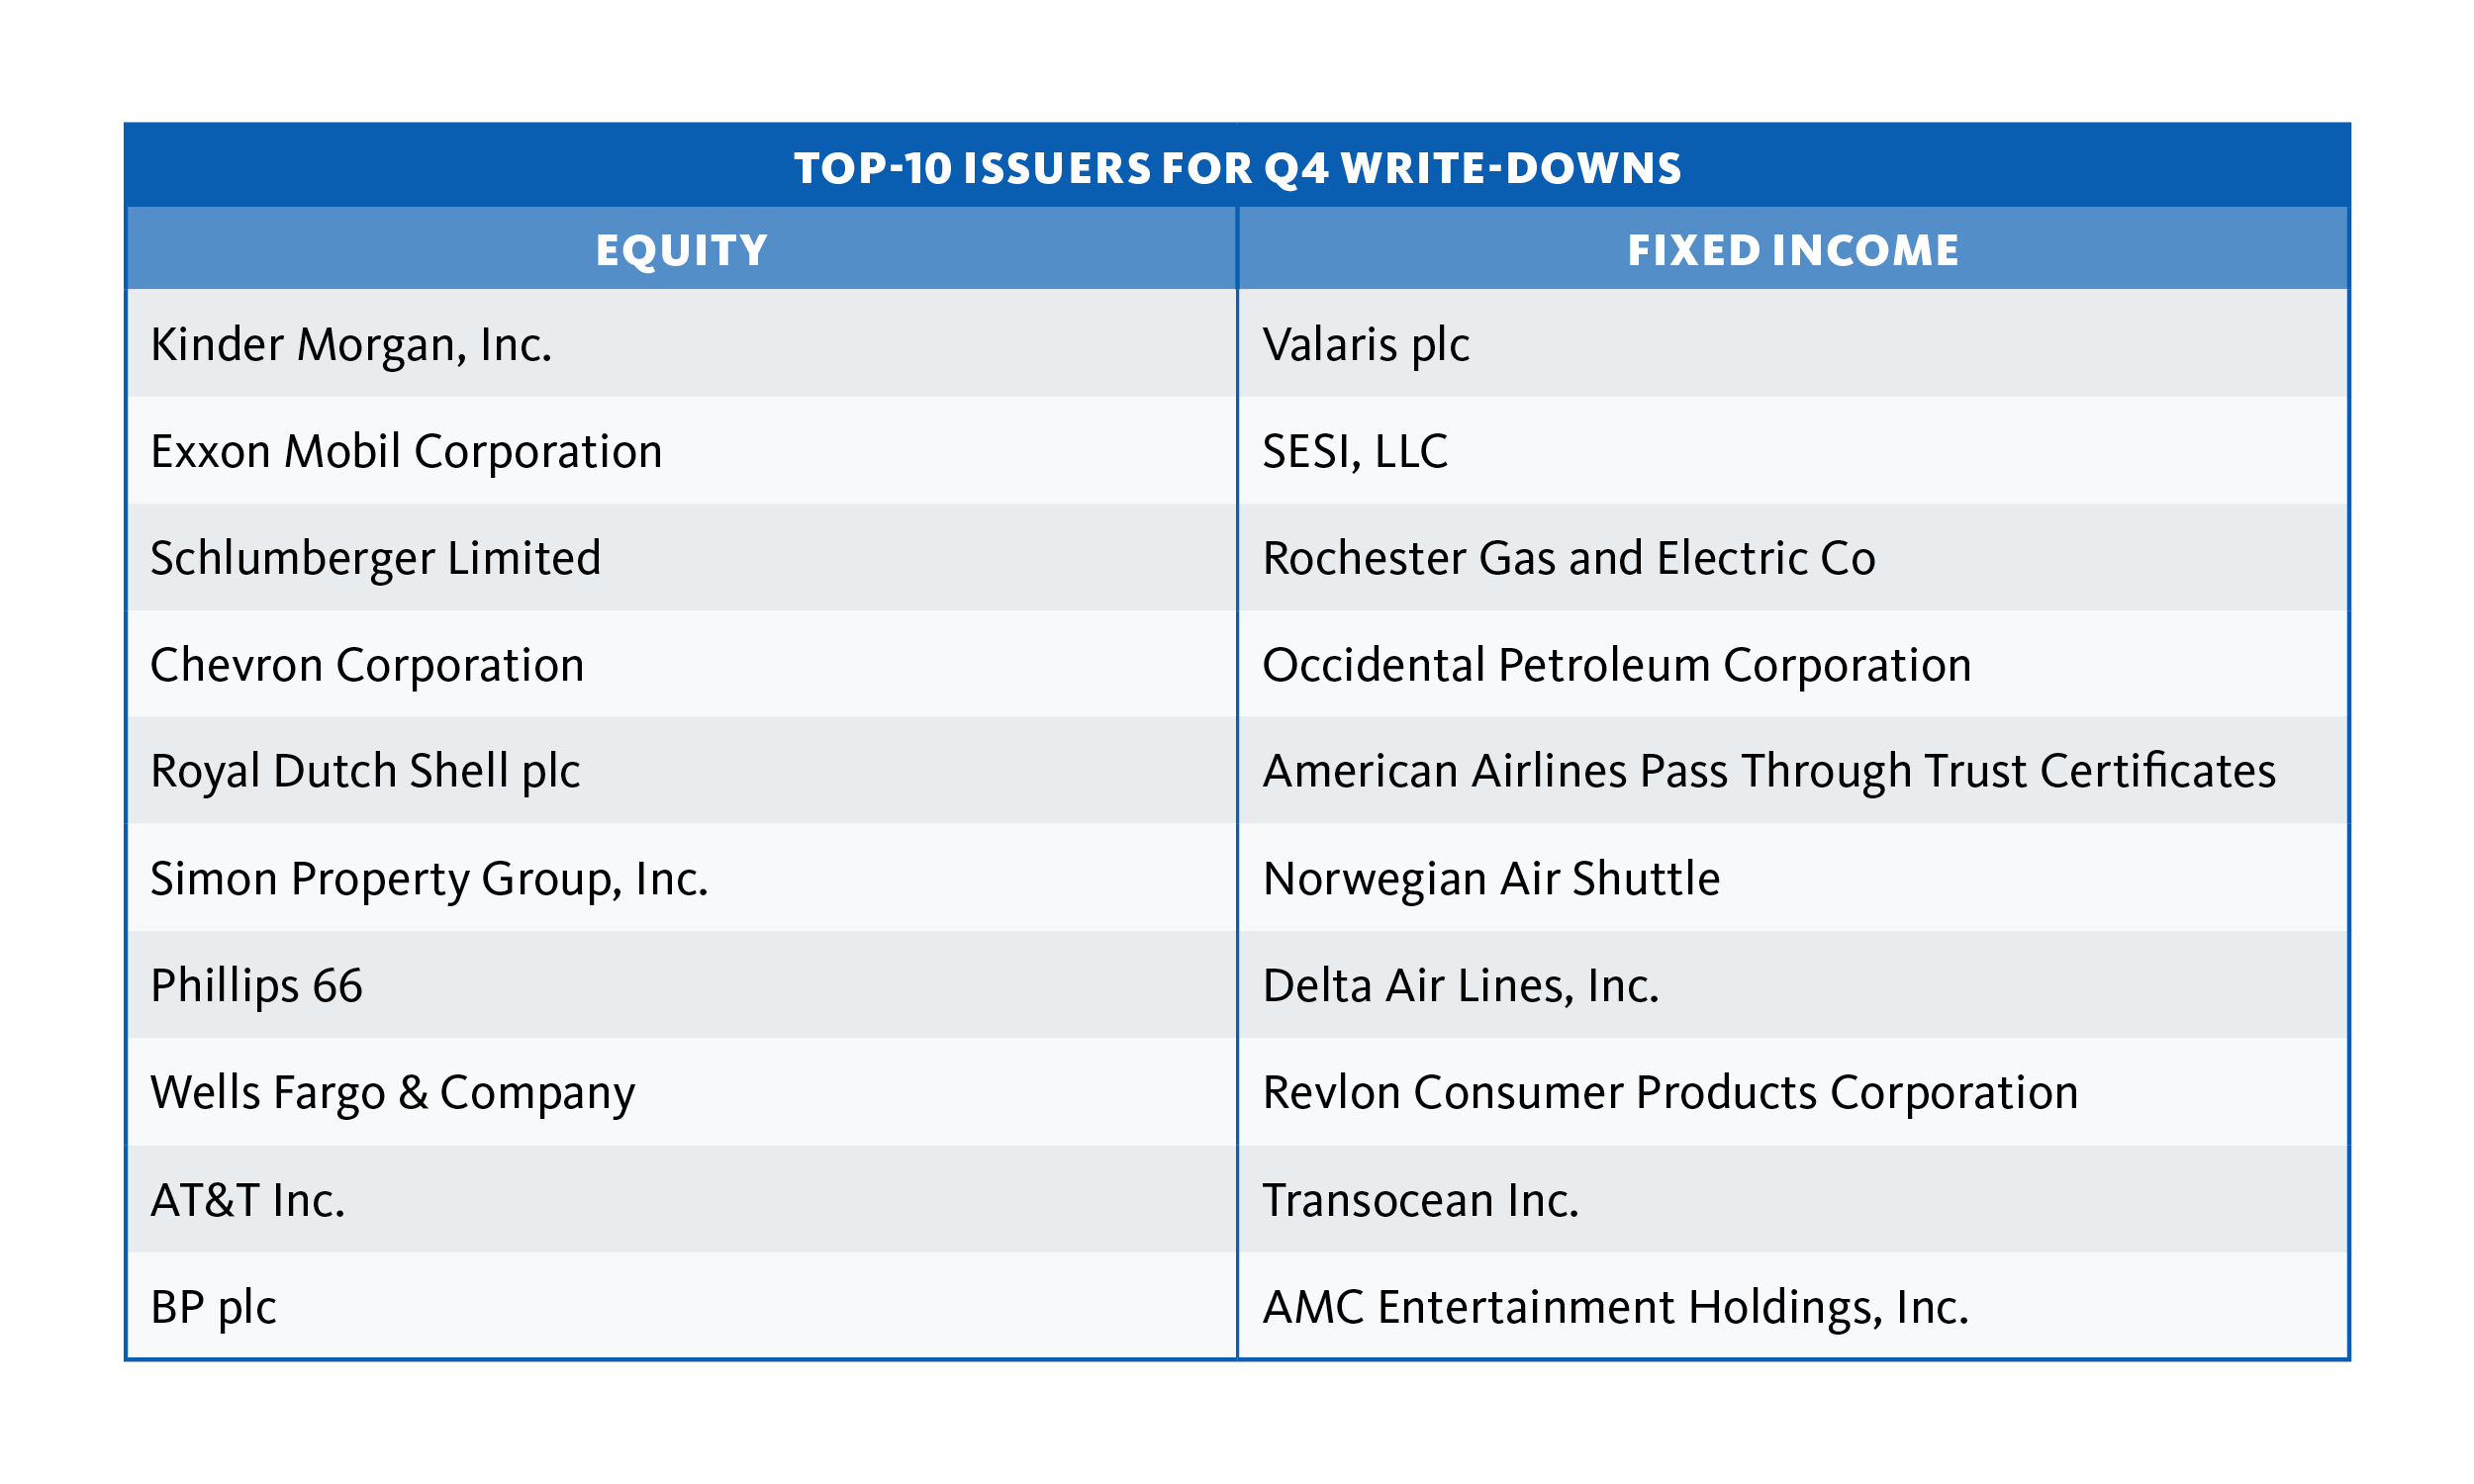
In Q4 2020, the top issuers selected for write-downs were tied to the energy and financial sectors. The chart below shows the Top 10 issuers selected for write-downs across both fixed income and equities.

We continue to watch impairment-related data closely and will share the relevant trends and market events we see playing out across our user base. Subscribe to Clear Insights to receive those updates straight to your inbox.
If you would like to learn more about the Clearwater solution, or see a demo of the system, don’t hesitate to get in touch. Our solutions consultants work closely with the world’s biggest institutional investors to understand their unique operational and technology needs. We would appreciate the opportunity to share what we know.
To learn more about how we are helping companies like yours, contact our Solution Consultants Team.