Despite elevated market volatility and softening macroeconomic data, corporate investment performance has been robust for several years, with a typical gain of 7% (cumulative) since December 2023. For firms who saw no gains as recently as four to five years ago (see blog), portfolios today continue to confer meaningful income to treasurers and CFOs.
The 7% figure, along with portfolio allocation data below, is drawn from the Clearwater Corporate Treasury Index (CCTI), developed by Clearwater to gauge the performance and strategy of our client base. The CCTI tracks approximately 400 portfolios of publicly traded companies, totaling ~$1 trillion in assets, and provides a valuable baseline for analyzing investment strategies within Clearwater’s corporate client base. According to CCTI data, average allocations are distributed across cash and equivalents (39%), U.S. treasuries (31%), corporate bonds (22%), and a small remaining portion (8%) comprising other government bonds, structured products, and stocks.
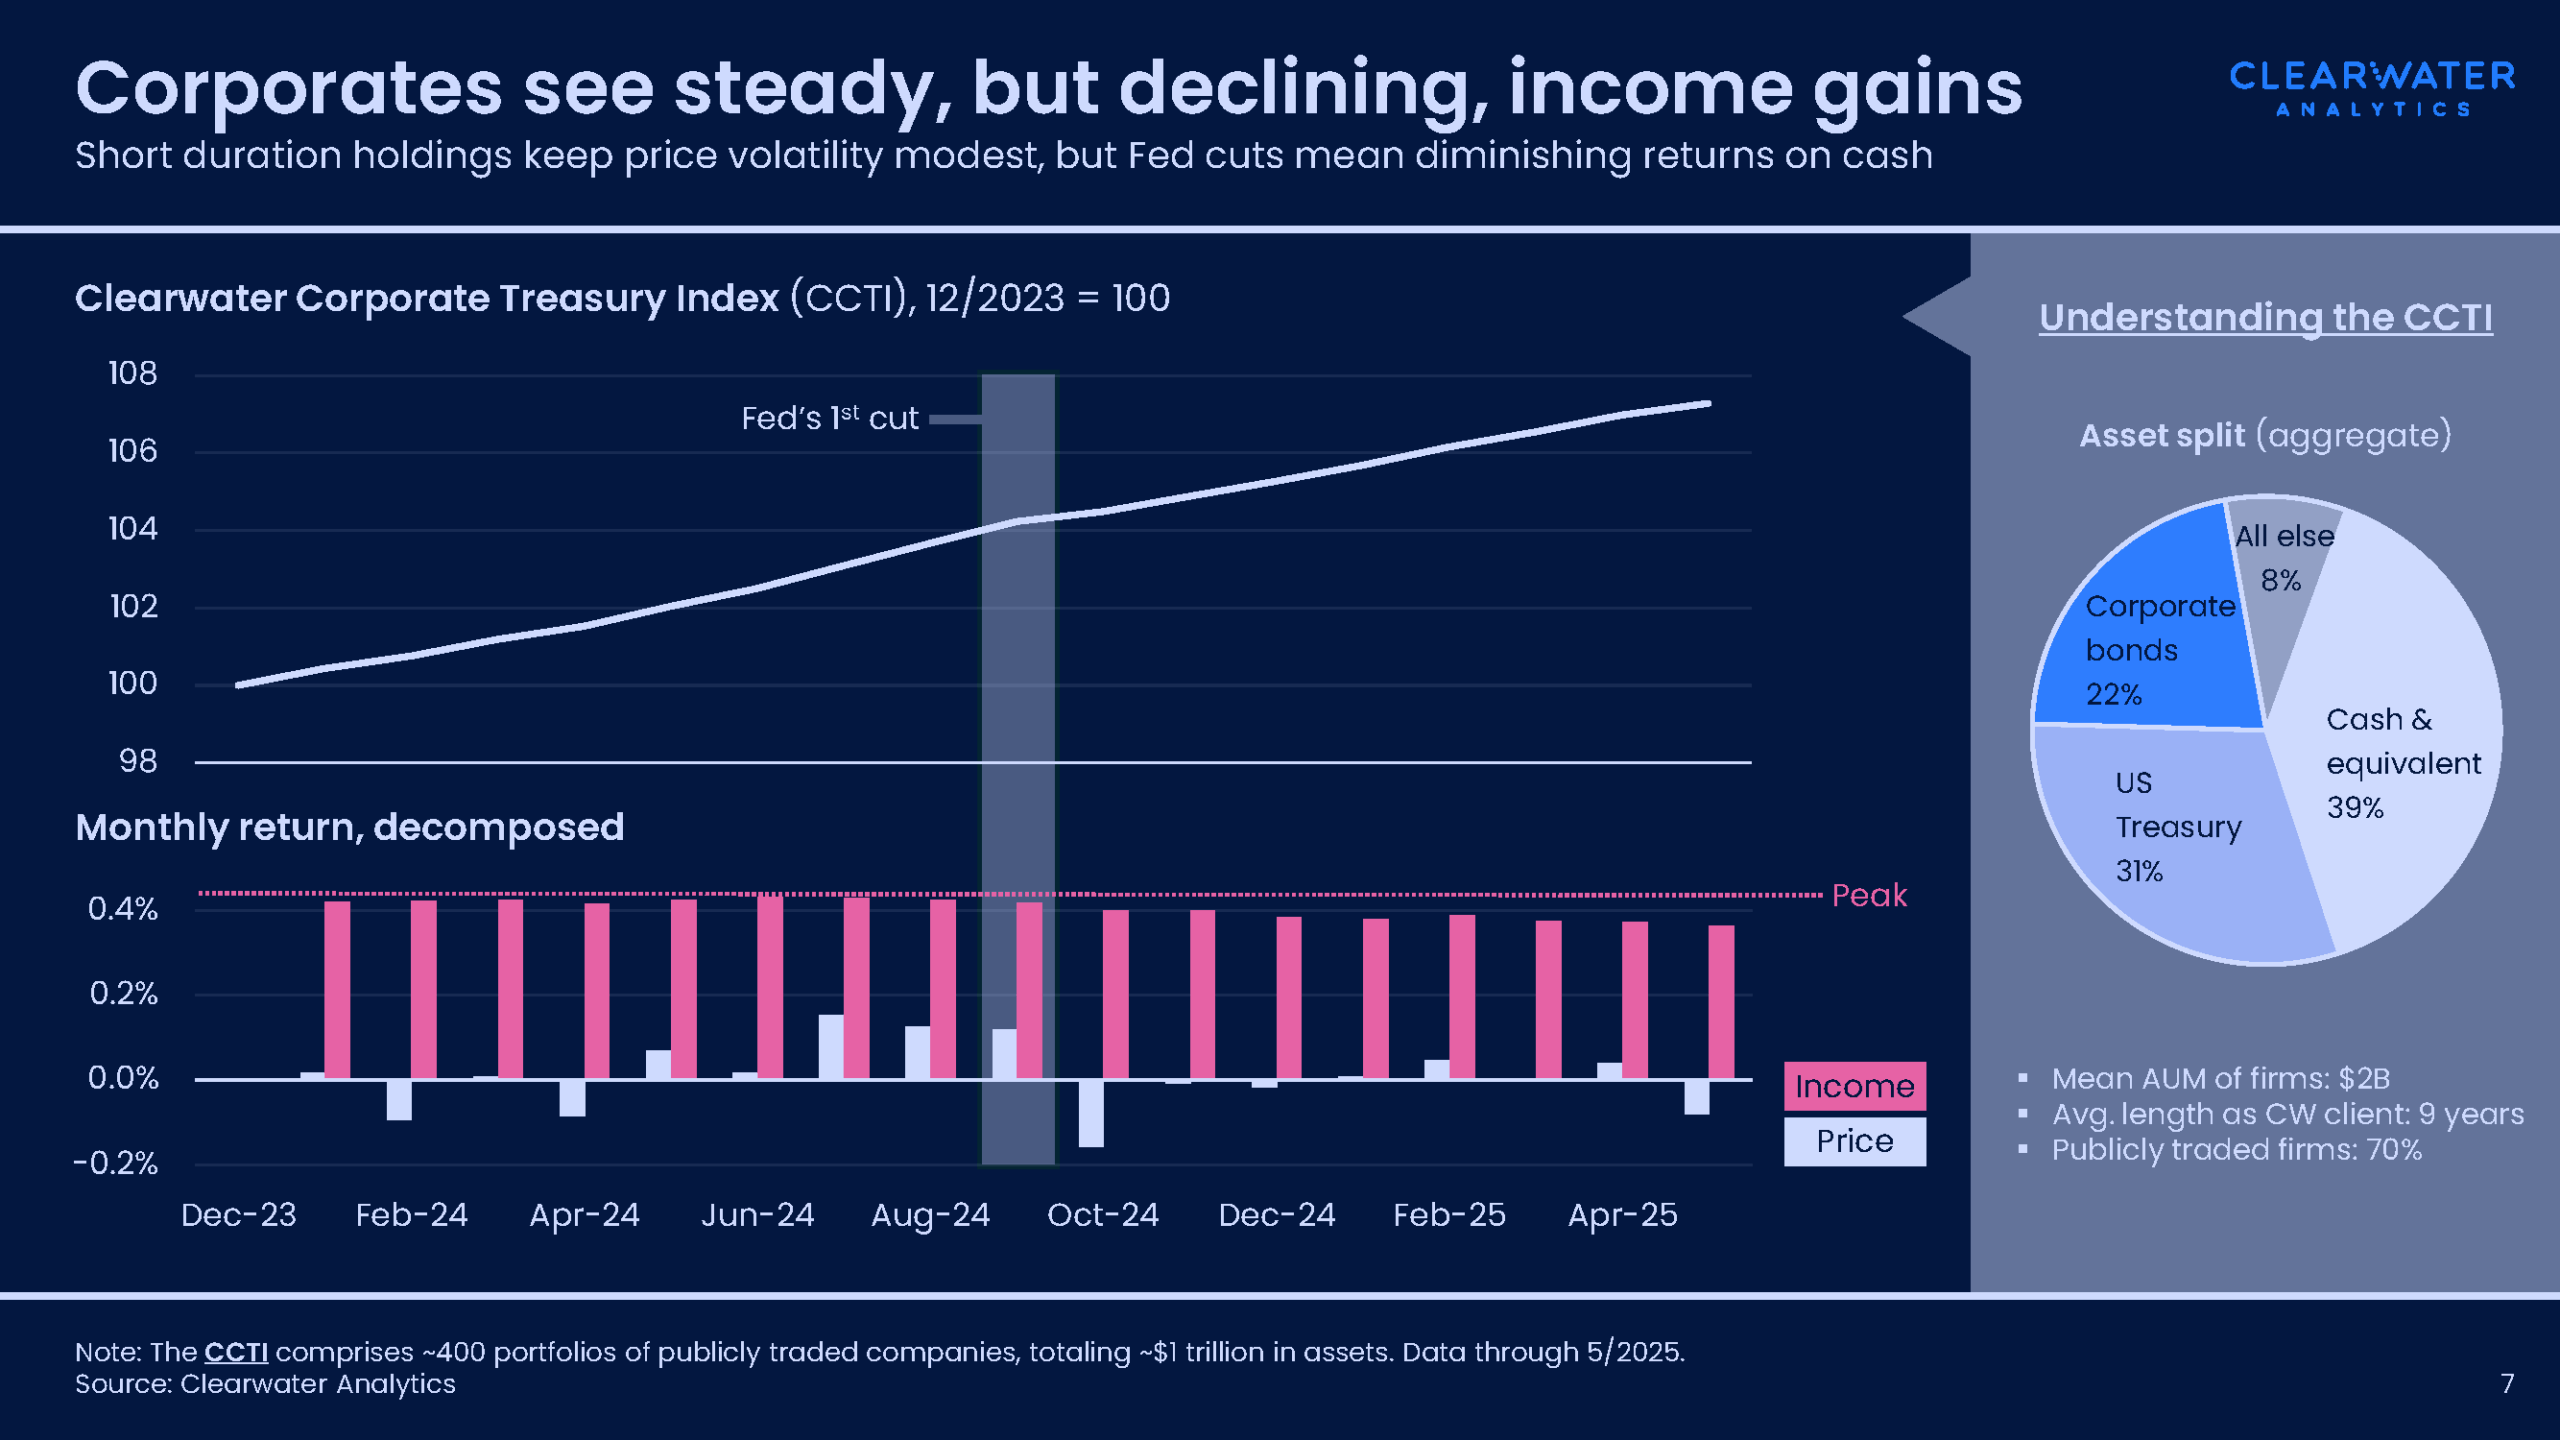
Figure 1: Clearwater Corporate Treasury Index (CCTI) average and monthly returns, and average allocations.
Rate cuts have (modestly) dented performance
With significant investments in cash and short-term debt, corporate investment income is inherently tied to the path of monetary policy. While the Federal Reserve has maintained a restrictive policy stance, ongoing cuts have impacted performance since last year, when corporates saw cyclically high returns. Since the Fed’s first 50-basis-points cut in September 2024, the CCTI has shown a gradual erosion of performance. Even so, returns sit meaningfully higher than most of the last decade.
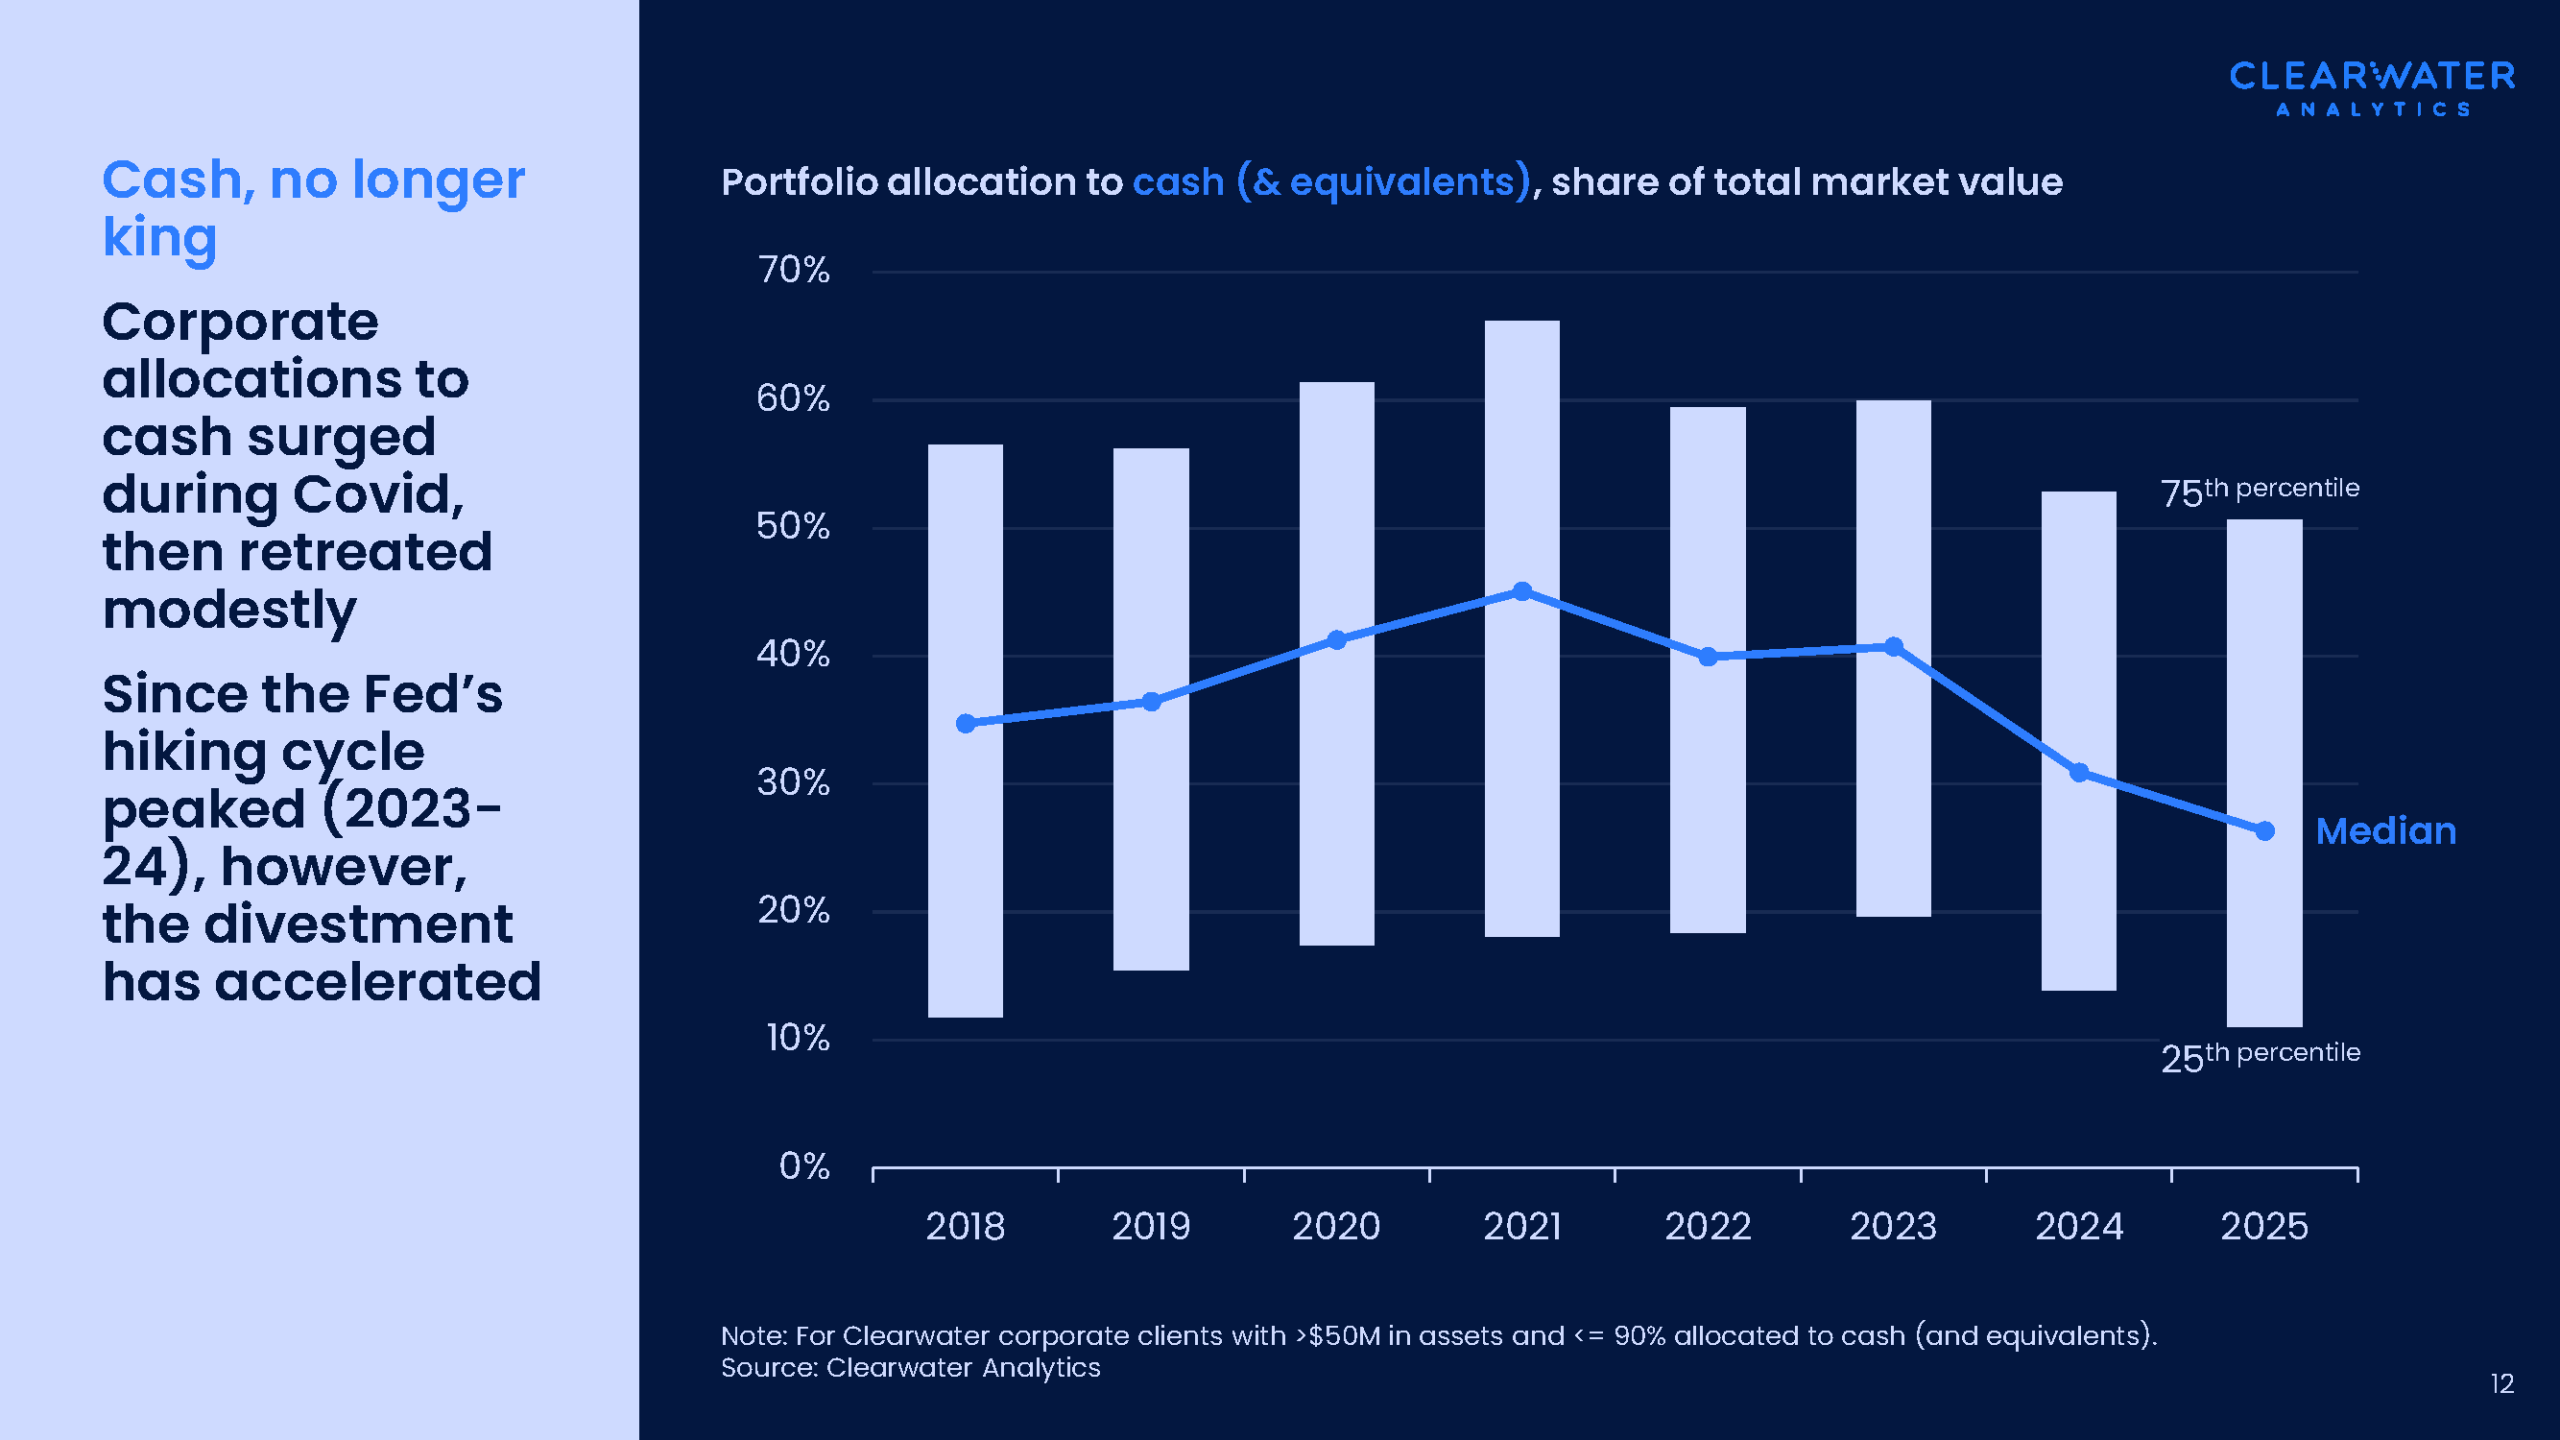
Median cash allocations reached a local peak of over 45% in 2021 in the wake of Covid, as the Fed held rates at the zero lower bound and corporates shied away from more aggressive strategies (see chart below). Today, as the Fed has cut, treasurers have shifted course: the median cash allocation of Clearwater’s corporate client base is now just 26%. While medians can be revealing, the larger bars point to the 25th-75th percentile ranges of our client base—corporates are hardly a monolith of strategy.
Where is the cash going?
Amid rate cuts and dipping cash allocations, what assets are corporates turning to instead?
The Fed’s rate increases (eventually) encouraged a shift from cash to bonds. The first moves were to Treasuries (>90 days time to maturity), with median holdings of T-bills jumping from a low of 8% to a current 17%. Then, starting in 2023, corporate investors reversed a five-year decline in corporate bond holdings, moving from a median low of 10% to today’s 17%, locking in yield as the Fed’s hiking cycle looked to top out.
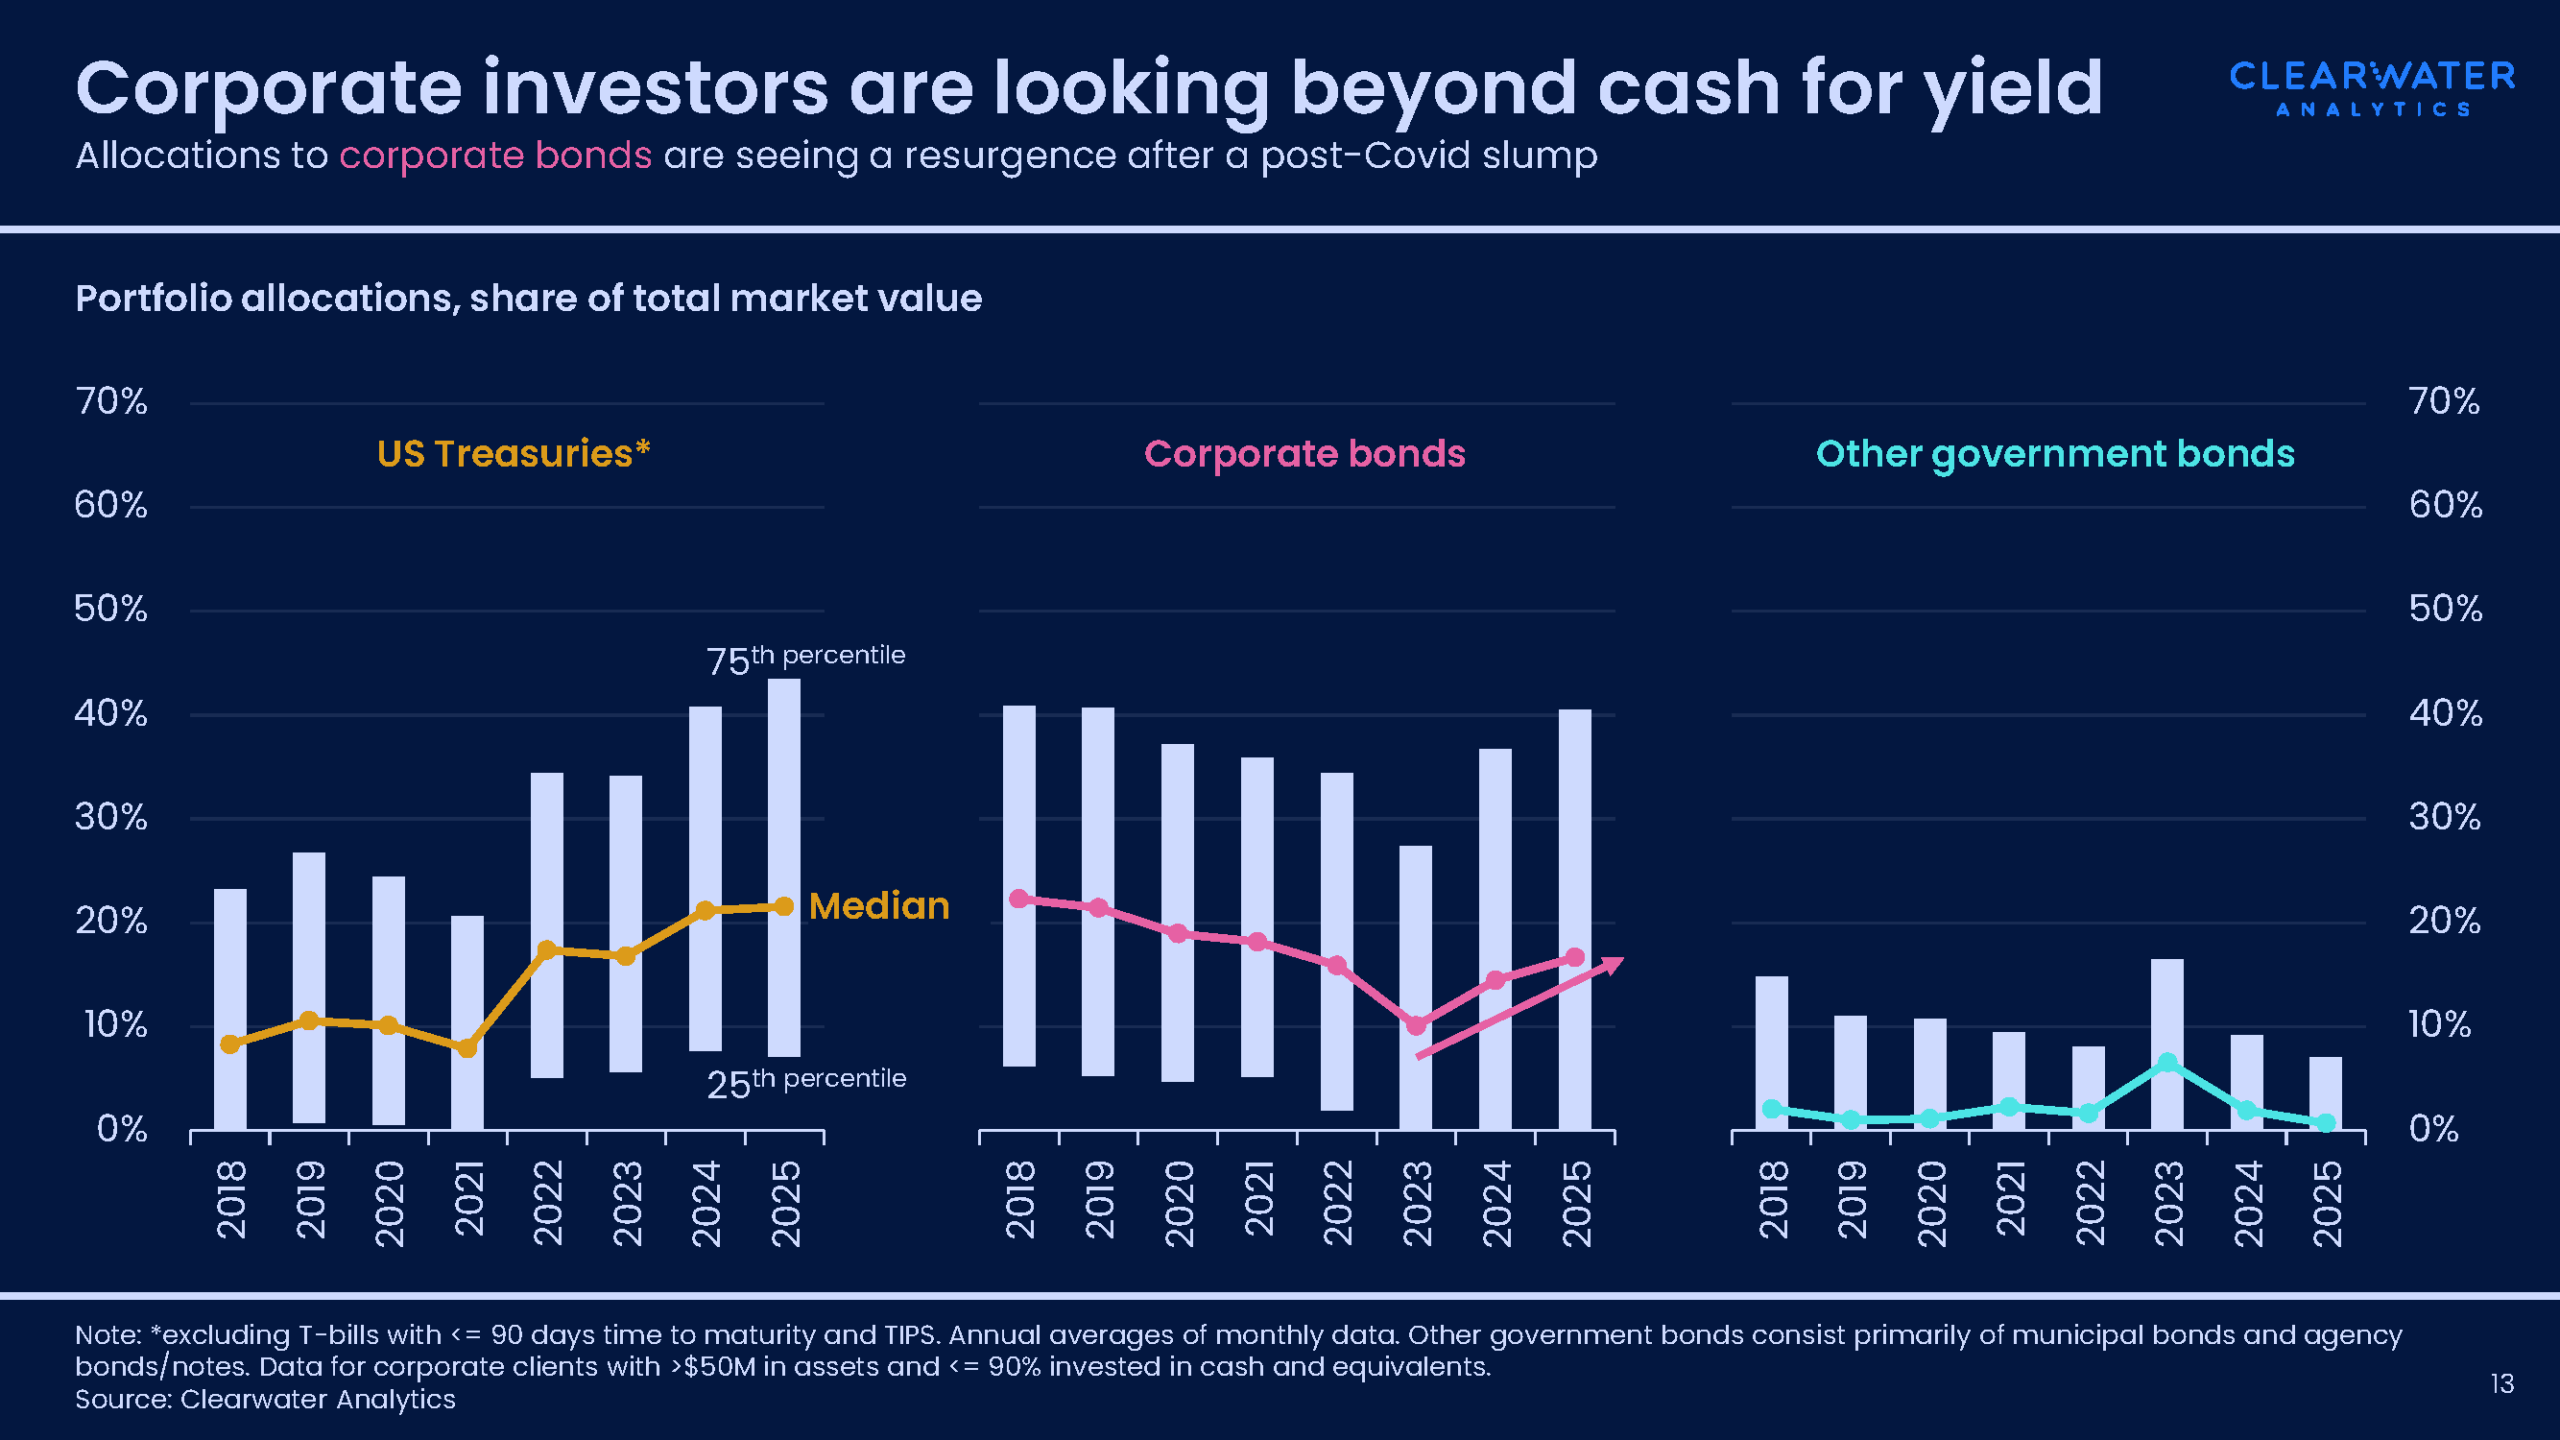
Figure 3: Corporate portfolio allocations to other than cash Note: Treasuries amount is excluding T-bills with less than 90 days’ time-to-maturity and TIPS. Annual averages of monthly data. Other government bonds consist primarily of municipal bonds and agency bonds/notes. Data is for corporate clients with more than $50M in assets and less 90% invested in cash and equivalents. Source: Clearwater Analytics
What has been the best strategy?
Diving into the data, we can compare performance across the distribution (25th, median, and 75th percentile) to see if there are notable differences in allocations.
In 2021 all three groups had near zero yields. As rates rose, the fastest movers deployed cash into Treasuries and significantly outperformed many of their peers, hitting twice the median return in 2022. The following year saw a big leap in yields; followed by a compressing of returns in 2024 as rates held steady; then, a narrowing between the top and bottom groups as returns converged to the median.
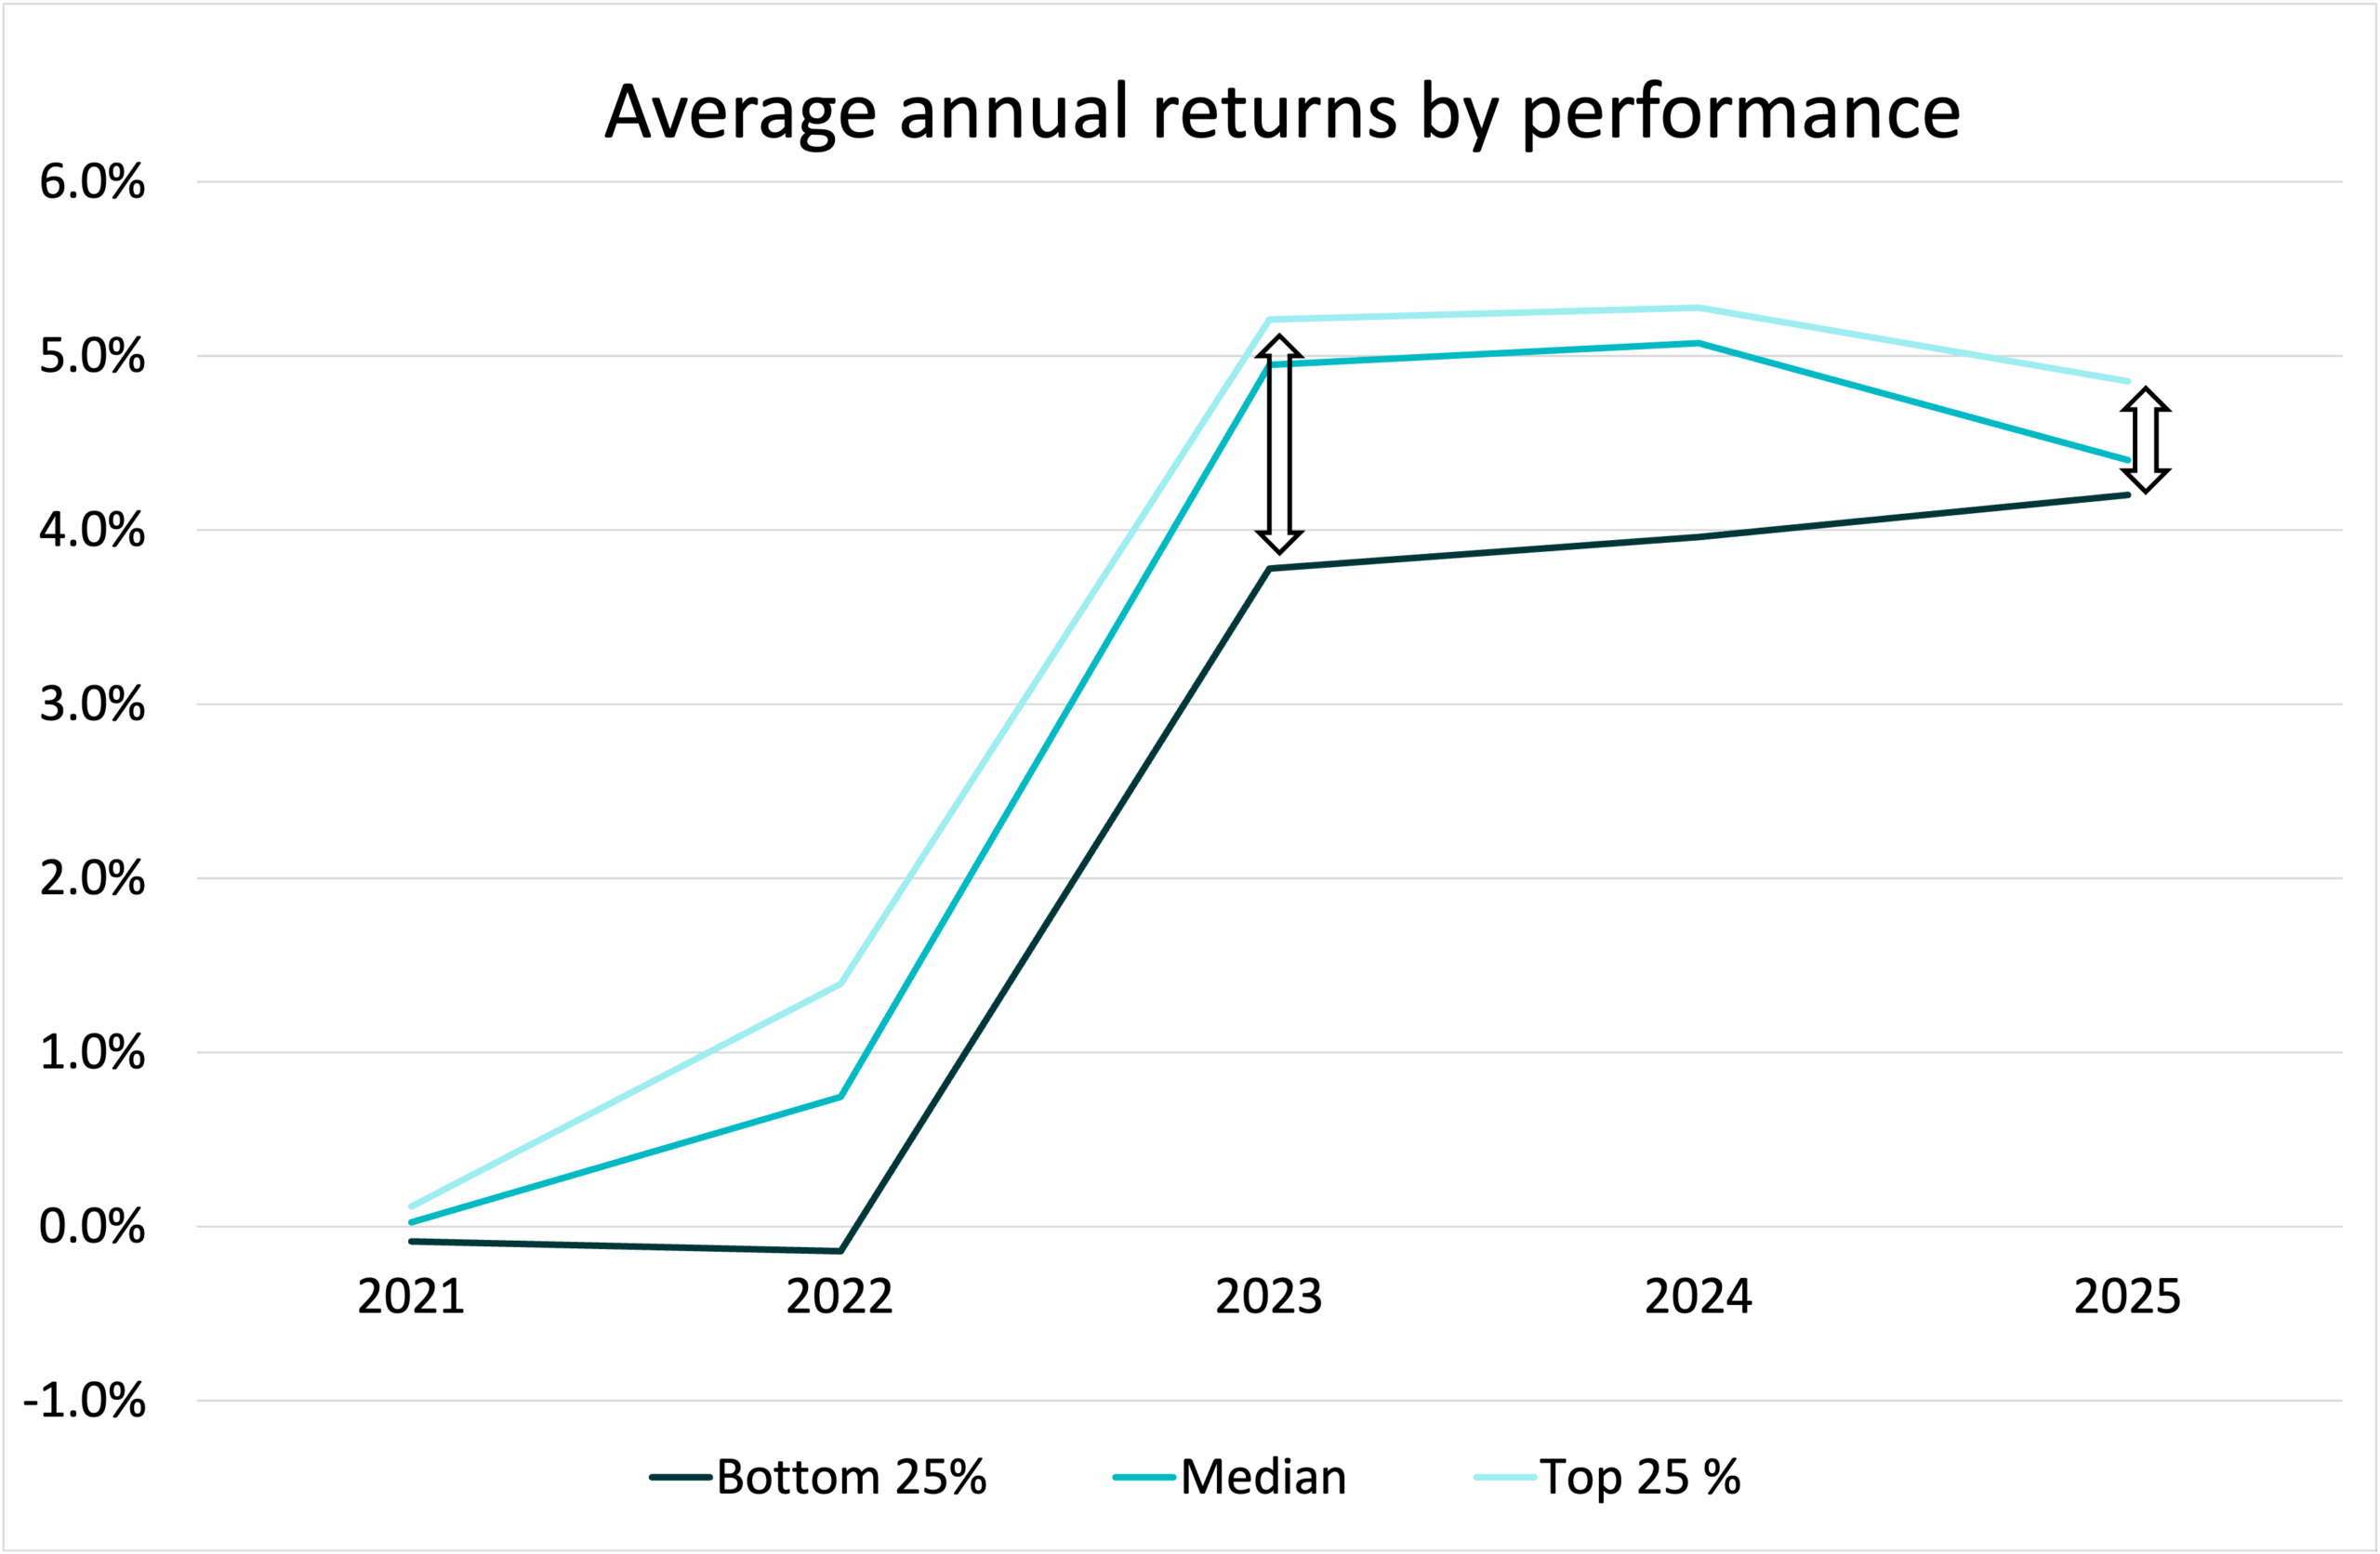
Figure 4: Comparing the average returns over the last 12 months of the bottom performing 25%, the median, and the top performing 25%
Where is the money now?
At the time of writing, the average corporation is heavily weighted in cash, followed by a similar share in Treasuries, a smaller but sizeable chunk in corporate bonds, and then a small mix of other assets.
The lowest performing group has almost half of their portfolio in Treasuries, followed by cash, and then equally small amounts of corporate bonds and other investments.
The top performers flip the script, with a primary weighting on corporate bonds, followed by cash, and then less than half the allocation share of treasuries than the lowest perfomers.
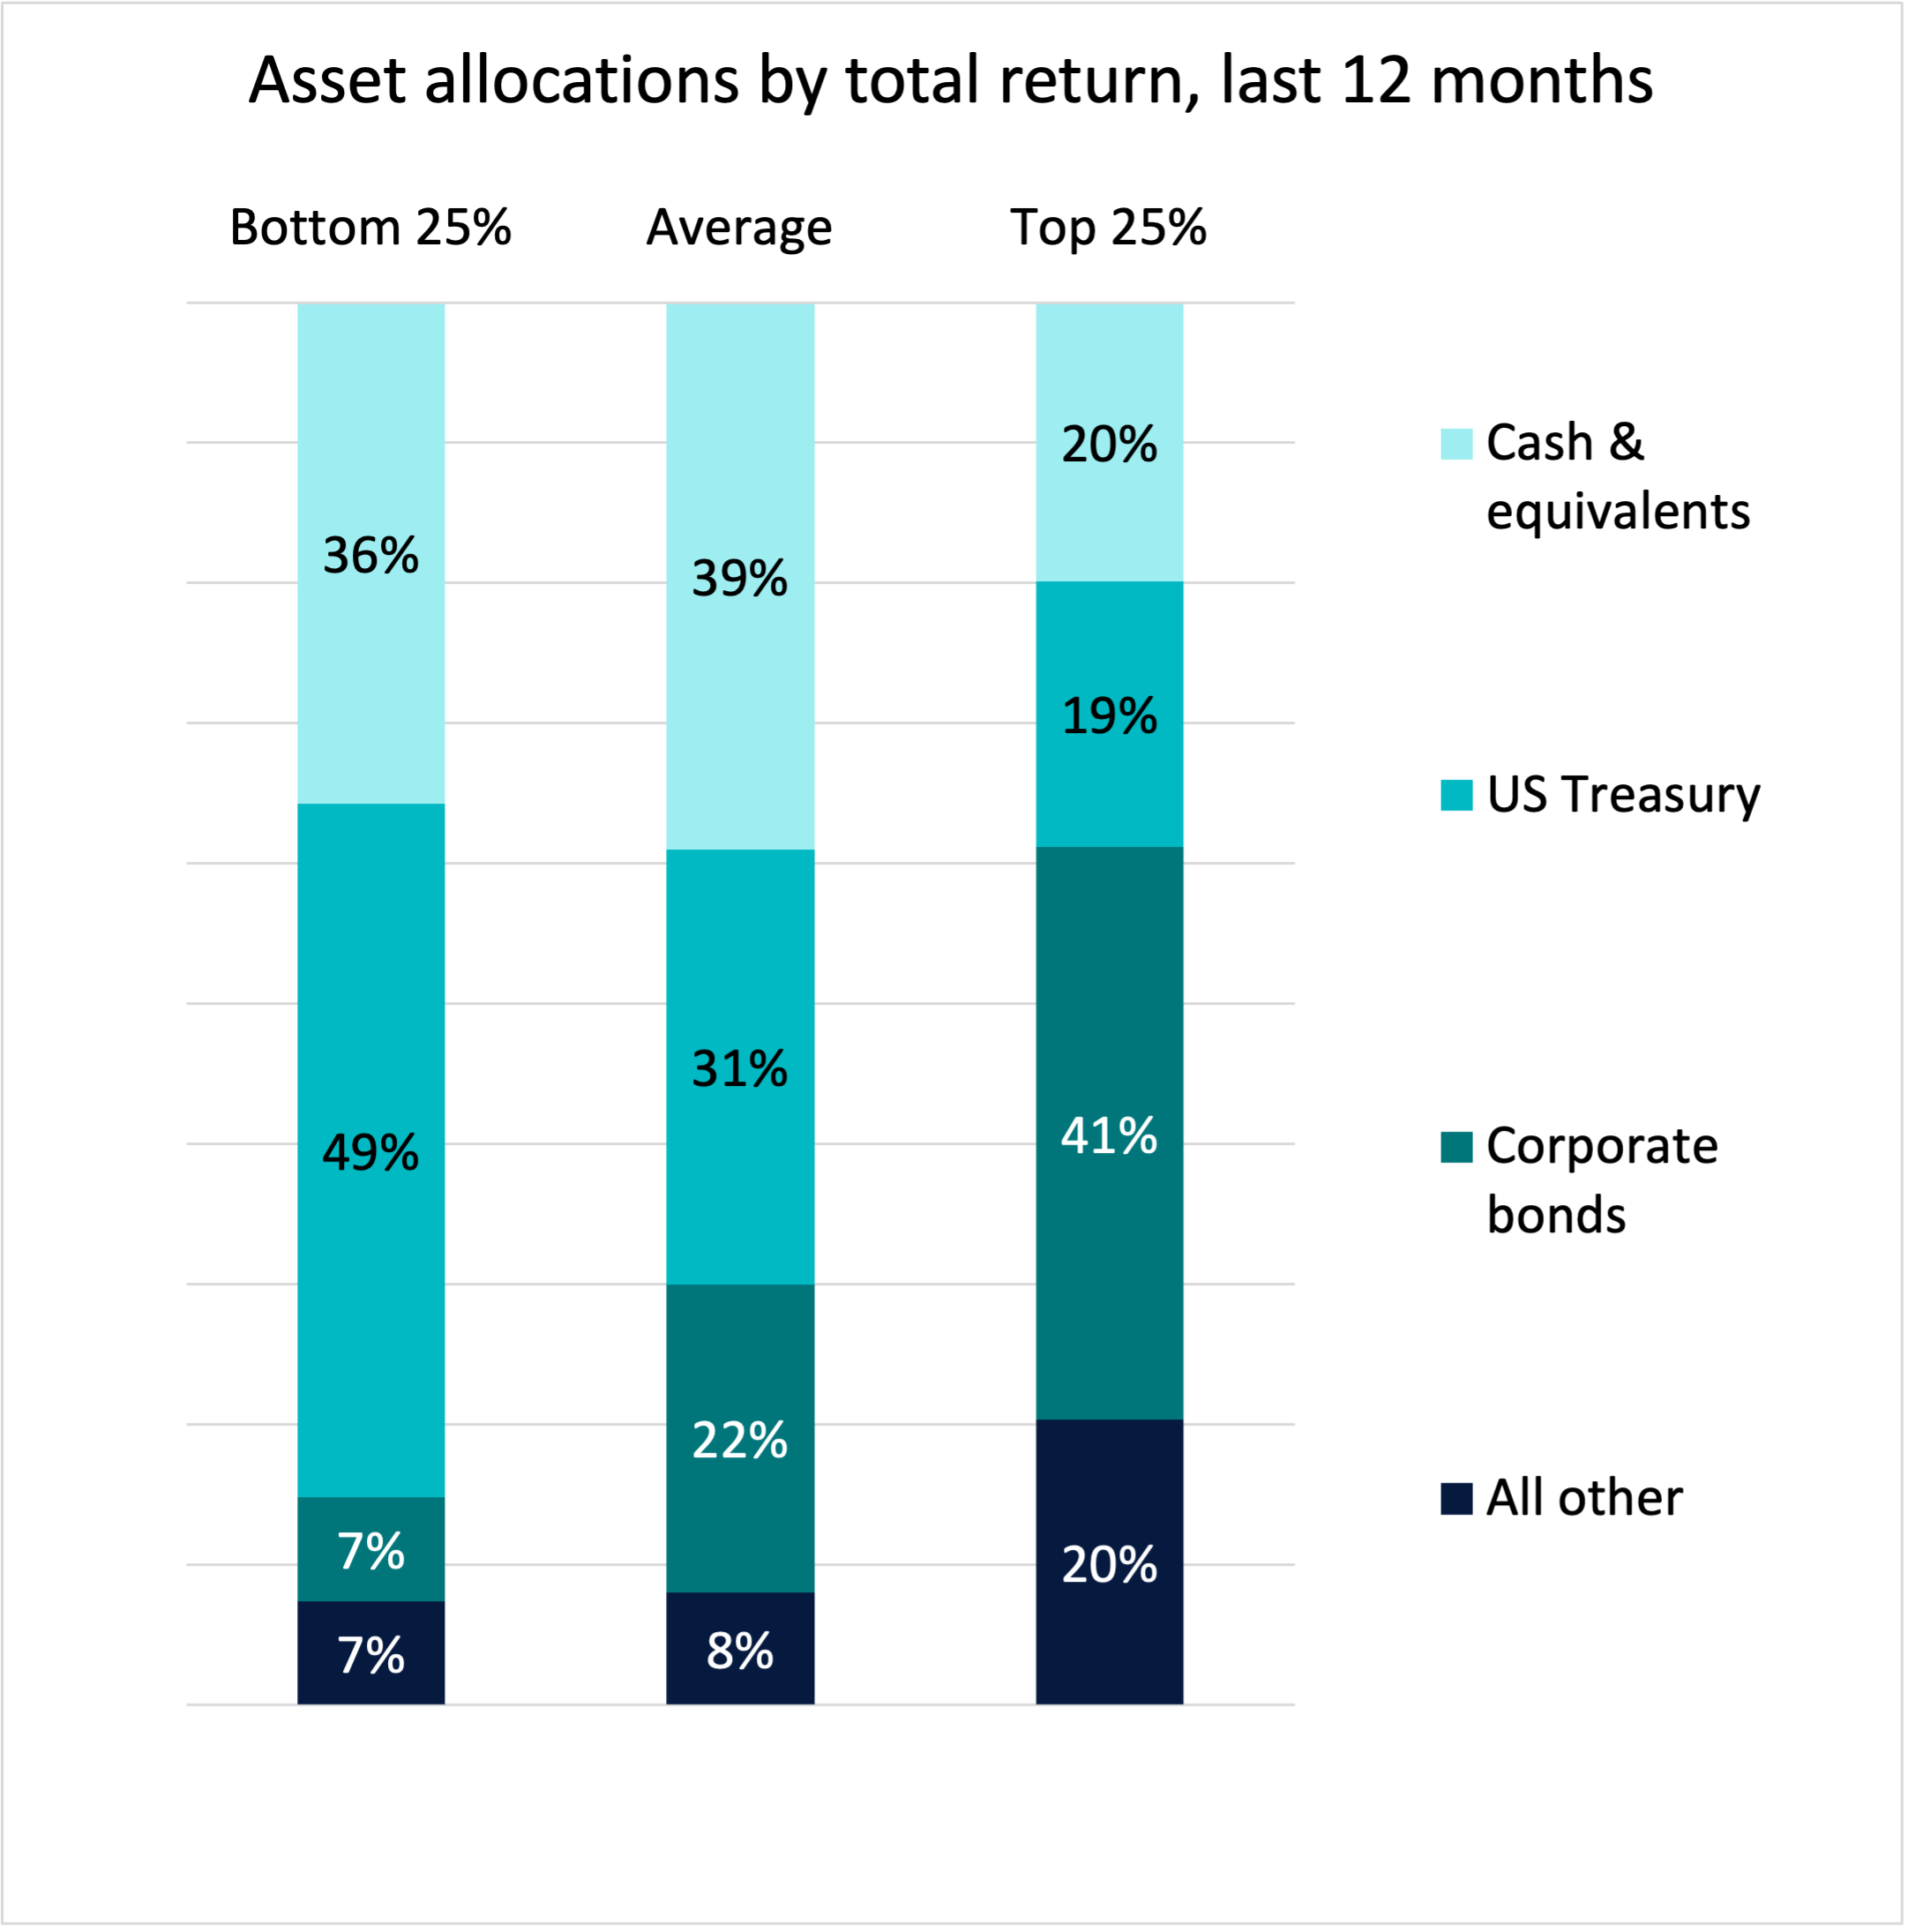
Figure 5: Corporate investment asset allocations by total return
Download the full report
If you are interested in the details of this analysis and additional insight on corporate treasuries and investments, download our Midyear macro update for corporates | The economy that wants to hang on.
About the research
This midyear macro update for corporates is based on a comprehensive review of the recent history of corporate investment performance, using Clearwater’s proprietary data. Data from about 800 corporate clients, with a combined $1.3 trillion in assets, was anonymized, analyzed, and compared for statistics such as total returns, asset allocations, and net flows.