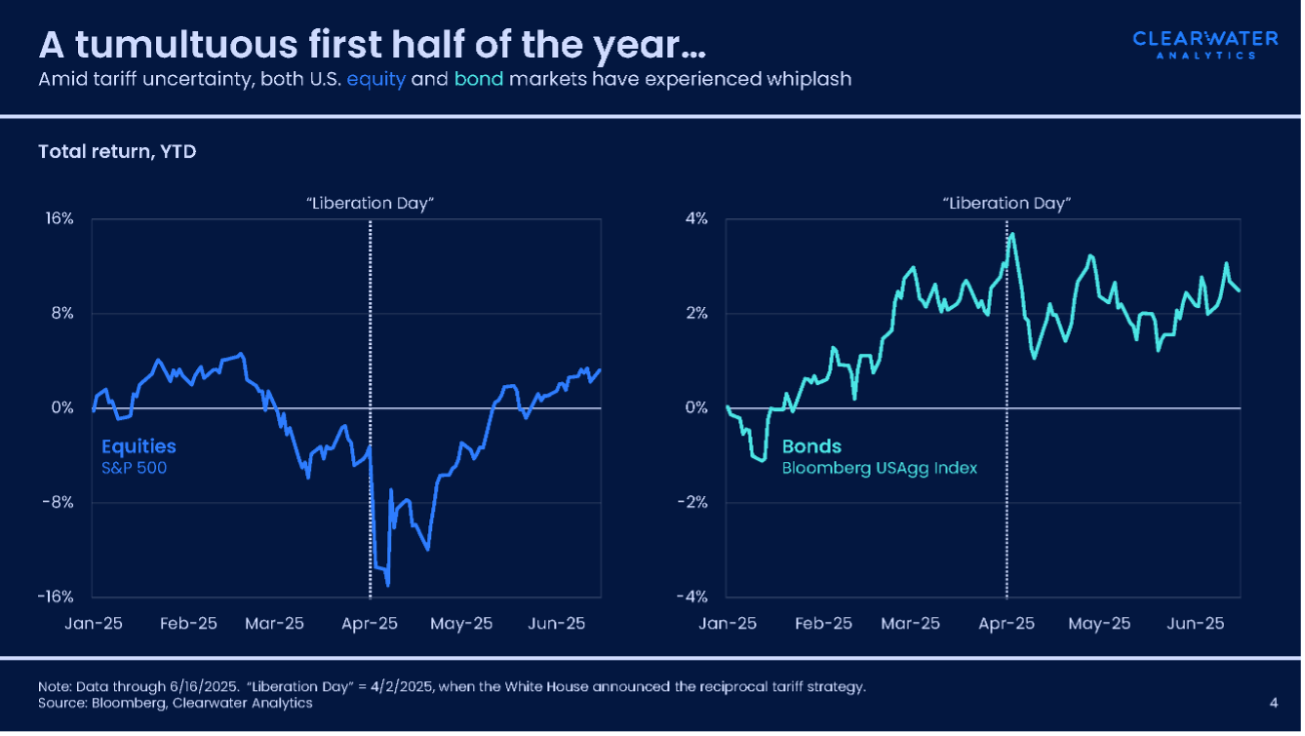
The first half of 2025 has not been easy for corporate treasurers and investment managers. Tariff policy from Washington, stoking renewed recession fears, has become a significant factor in tactical allocation strategies. Both equity and bond markets in the U.S. have experienced significant whiplash year to date, with volatility reaching a crescendo during and around “Liberation Day” on April 2nd. At the time of this writing, however, the S&P 500 is notching new highs, despite newly announced tariffs that situate U.S. trade policy in much more protectionist territory than last year. With major trade deadlines pushed out again until August 1st, uncertainty lingers for investors and businessowners alike.
Corporates have fared well
In this environment, even as the Fed’s hiking cycle topped out, corporate investors continued to be aided by high short-term interest rates. To gain insight into performance, Clearwater’s research team looked at proprietary data from more than 800+ corporate clients on Clearwater’s platform, comprising $1.3 trillion in assets under management (AUM).
| Dataset details | |
| Corporate clients | 800+ |
| Publicly traded | 60% |
| Median AUM | $250 million |
| 25th percentile AUM | $110 million |
| 75th percentile AUM | $690 million |
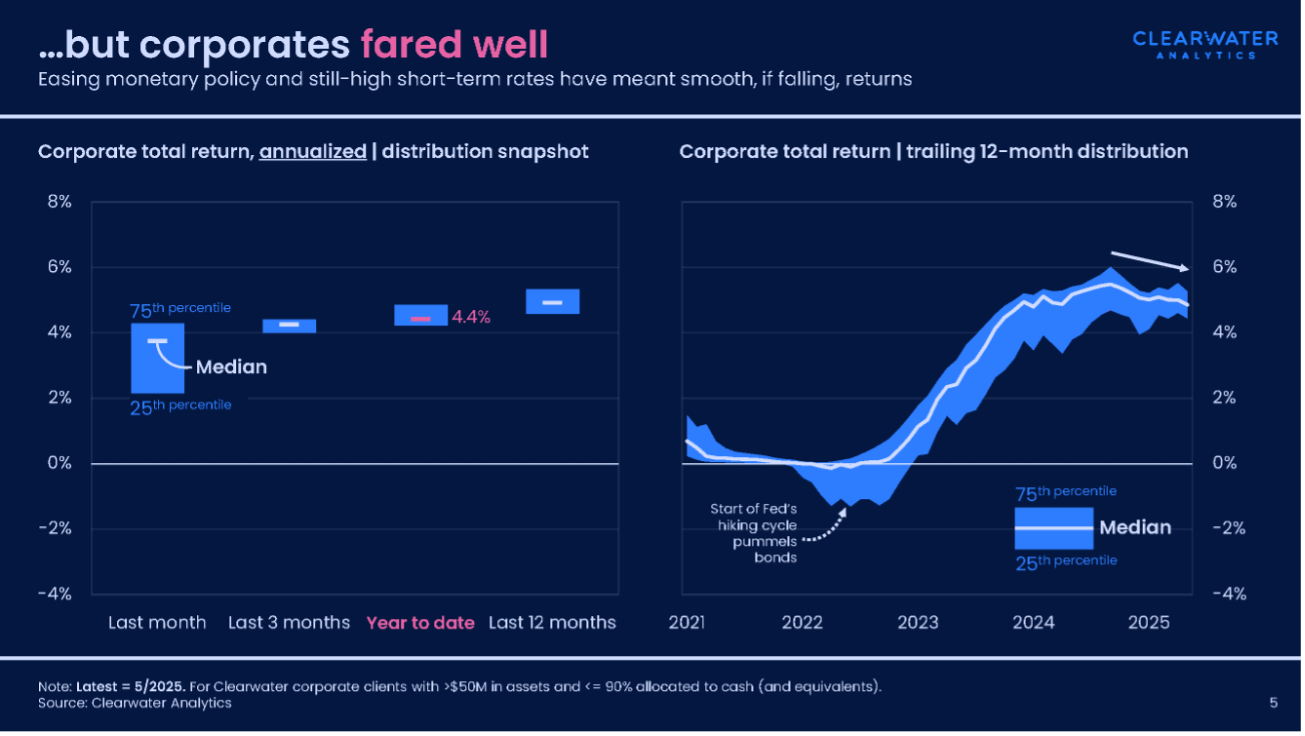
Small differences in performance can have meaningful impact on income generation, particularly when considering the size of these portfolios. Comparing a few different time horizons, including the last three months, year to date, and last 12 months, we see tight distributions of returns, with medians between 4.25 percent and 4.9 percent and the gap between the 25th and 75th percentile groups ranging from 0.4 to 0.8 percent.
Comparing 12-month total returns
While dipping slowly now, total returns are close to the highest they have been in years. Looking back to 2021, corporate investments weren’t making many gains, with 12-month total returns flat and close to zero – and many firms lost a percent or so when the Fed began to hike rates in 2022. By 2023, returns were steadily climbing with a one or two percentage point difference between the 25th percentile and the 75th percentile, and returns peaking at 6 percent for the best performers in September 2024. By 2025, the earnings gap has tightened to less than one percentage point, with a median total return of around five percent in May 2025.
What’s driving bond performance?
With a median AUM of $250 million, it’s clear that half a point or so of higher annualized returns translates to more than $1 million in extra income. As corporates face tight restrictions on investment assets, changes in cash and fixed income investments are responsible for most divergence in performance. In today’s investment environment, total return for bonds is being driven not by price returns (volatility remains quite elevated) but by income. Written off in the late-2010s, quality fixed income can now provide steady returns, particularly for those who hold to maturity.
While higher rates can be burdensome when firms are hoping to raise capital, their flipside is better performance for cash managers. As long as the Fed stays the current course, corporate investors can keep on earning strong returns.
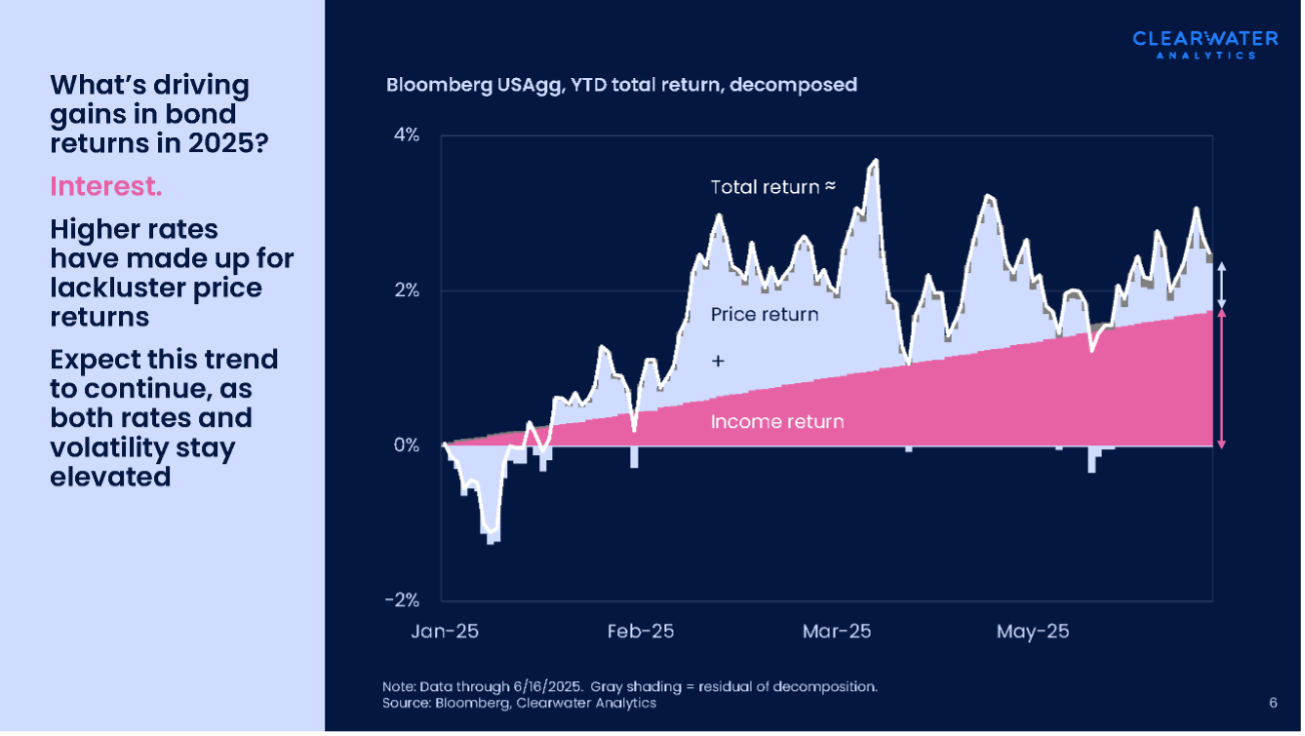
Can price returns recover for high quality fixed income assets? Perhaps, but most likely in the event of a risk-off environment, which is far from our base case. For now, with tariff price pressures in the offing, monetary policy is likely to remain in restrictive territory (even if easing). And creditors will continue to demand yield.
Download the full report
If you are interested in the details of this analysis and additional insight on corporate treasuries and investments, download our Midyear macro update for corporates | The economy that wants to hang on.
About the research
This midyear macro update for corporates is based on a comprehensive review of the recent history of corporate investment performance, using Clearwater’s proprietary data. Data from about 800 corporate clients, with a combined $1.3 trillion in assets, was anonymized, analyzed, and compared for statistics such as total returns, asset allocations, and net flows.